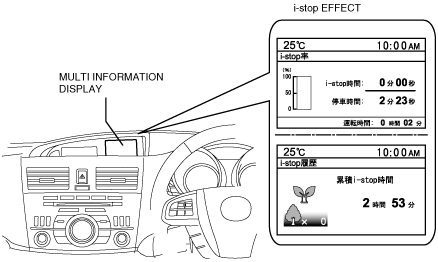
i-stop EFFECT DISPLAY
id092200026100
Purpose
• The i-stop effect display informs the driver of i-stop effect information.
Function
• i-stop effect displays the i-stop ratio and history based on the i-stop related information signal from the PCM.
-
― i-stop ratio
-
• i-stop time
• Vehicle stop time
• Period of time vehicle is driven
― i-stop history
-
• Total i-stop time
• Cumulative total effect (tree quantity)
i-stop time
-
• i-stop time is displayed as the total i-stop operation time from engine start (ignition switch: ON) to engine stop (ignition switch: OFF).
• The range of i-stop time is from 0 s to 999 min 59 s.
Vehicle stop time
-
• The vehicle stop time is displayed as the total time at which the vehicle speed is 1 km/h or less from engine start (ignition switch: ON) to engine stop (ignition switch: OFF).
• The range of vehicle stop time is from 0 s to 999 min 59 s.
Period of time vehicle is driven
-
• The period of time the vehicle is driven is displayed as the total time at which the vehicle speed is 3 km/h or more from engine start (ignition switch: ON) to engine stop (ignition switch: OFF).
• The range for the period of time the vehicle is driven is from 0 s to 99 hours 59 min.
Total i-stop time
-
• Total i-stop time is displayed as the total time at which the i-stop has operated.
• The range of total i-stop time is from 0 to 9999 hours 59 min.
i-stop ratio
-
• The current i-stop ratio is displayed as the percentage of i-stop operation time while the vehicle is stopped from engine start (ignition switch: ON) to engine stop (ignition switch: OFF).
Cumulative total effect
-
• The cumulative total effect is displayed as the calculated value from the amount of idling time and i-stop time.
-
― Cumulative total effect (Trees) = idle amount (L/Sec.) × i-stop time*1(seconds) × 5.8 (constant (Area corresponding to forestation)) × 0.041 (constant (tree quantity))
― Example: If i-stop function operates for 5 min a day, the total time is 1825 min. per a year and the tree quantity for the cumulative total effect is 3.6 trees.
*1 :Time in which i-stop function operated from engine start (ignition switch: ON) to engine stop (ignition switch: OFF)
• The stages of tree growth for the cumulative total effect are displayed according to the cumulative total as follows:
|
Display content
|
Function
|
 |
The growth of 0 to 0.3 trees is displayed.
(i-stop total time: 2 hours 56 min.)
|
 |
The growth of 0.4 to 0.6 trees is displayed.
(i-stop total time: 3 hours 27 min.)
|
 |
The growth of 0.7 to 0.9 trees is displayed.
(i-stop total time: 6 hours 58 min.)
|
 |
The number of grown trees is displayed.
|
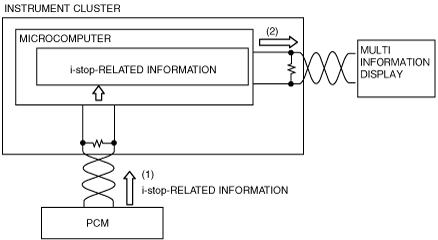
Construction
• The i-stop effect is displayed in the multi information display.
• i-stop effect display and time at i-stop calculations are performed by the instrument cluster microcomputer.
• When the ignition is switched ON or OFF, the i-stop ratio and history are displayed in the i-stop effect display.
• When the ignition is switched from ON to OFF, the current i-stop ratio and cumulative total effect (tree quantity) are displayed in the i-stop effect display for a specified time.
Operation
1. The instrument cluster receives (1) the i-stop related information signal from the PCM via the CAN signal.
2. The instrument cluster sends (2) the calculated i-stop related information signal to the multi information display.
3. When the i-stop related information signal is received, the multi information displays it.